Все науки. №1,2025. Международный научный журнал
Қосымшада ыңғайлырақҚосымшаны жүктеуге арналған QRRuStore · Samsung Galaxy Store
Huawei AppGallery · Xiaomi GetApps

автордың кітабын онлайн тегін оқу  Все науки. №1,2025. Международный научный журнал

Все науки. №1,2025

Международный научный журнал

Шрифты предоставлены компанией «ПараТайп»


Авторы: Алиев Ибратжон Хатамович, Қўлдашов Ғолибжон, Абдураҳмонов Султонали, Билолов Иномжон, Исроилов Шаробиддин, Маматова Зилолахон, Рустамов Умиджон, Отажонов Салим, Абдуллаэв Шерзод, Носирова Маржона, Абдурашидова Сурайёхон, Рўзалиев Шерзоджон Авазжонович, Солиева Шамсинурхон, Алиев Муҳаммадали


Главный редактор, Директор НИИ "ФРЯР" Ибратжон Хатамович Алиев

Научный директор Боходир Хошимович Каримов

Технический директор Султонали Мукарамович Абдурахмонов

Экономический директор Ботирали Рустамович Жалолов

Заместитель главного редактора Миродилжон Хомуджонович Баратов

Редактор Гулчехра Ғуламжановна Ғаффарова

Иллюстратор Ибратжон Хатамович Алиев

Иллюстратор Фарходжон Анваржонович Иброхимов

Дизайнер обложки Раънохон Мукарамовна Алиева

Корректор Гулноза Мухтаровна Собирова

Корректор Дилноза Орзиқуловна Норбоева


профессора, доценты, преподаватели, сотрудники, магистры, студенты и иные

самостоятельные исследователи. Каждый из них активно проводит научные

исследования в разных областях науки и техники, представляя в качестве


12+

Оглавление

ФИЗИКО-МАТЕМАТИЧЕСКИЕ НАУКИ

A New Approach To The Analysis Of Nuclear Reactions Under The Influence Of High-Energy Particles On A Stationary Target Nucleus In The Physics Of Resonant Nuclear Reactions

UDK:53.08

Ibratjon Aliyev1, G’olibjon Qo’ldashov2, Sultonali Abdurakhmonov3, Inomjon Bilolov4 and Sharobiddin Isroilov4

1 SRI «PRNR», Electron Laboratory LLC, 151100, Margilan, Fergana region, Republic of Uzbekistan
2 National Research of «Renewable Energy Sources» under the Ministry of Energy of the Republic of Uzbekistan, 100000, Tashkent region, Tashkent, Republic of Uzbekistan
3 Fergana Polytechnic Institute, 150100, Fergana, Fergana region, Republic of Uzbekistan

4 Fergana branch of Tashkent University of Information Technologies named after Mukhammad al-Khwarizmi, 150118, Fergana, Fergana region, Republic of Uzbekistan

Abstract. The paper presents a new form of complex analysis of nuclear reactions brought to a state of resonance. This state of nuclear reactions is investigated according to the model of physics of resonant nuclear reactions. The study examines each channel of the nuclear reaction, calculates the nuclear effective cross-section of each of the channels before and after reduction. During the analysis, attention is drawn to the theoretical study of the energy characteristics of the products of each of the reaction channels, with a percentage ratio. The temperature gradients of the nuclei and targets formed at different stages of the reaction are determined. As a result, a complete model has been formed to create a complete description of the nuclear reaction being produced and analyzed, which makes it possible to theoretically predict the outcome of any nuclear reaction. The analysis concludes with the final result in the form of all parameters of the nuclear reaction products at all stages.

Keywords: nuclear reaction channels, nuclear effective cross section, probabilistic nuclear reaction channels, nuclear reaction analysis.

Introduction

The implementation of a nuclear reaction is the bombardment of a beam of charged particles — ionized nuclei, leptons, elementary particles of other categories with selected parameters of the target nuclei. To date, in order to study nuclear reactions [1—2] occurring during bombardment by high-energy charged particles of stationary target nuclei, experimental research is primarily being conducted using charged particle accelerators at different beam energies with different levels of monochromatization [3—4; 8]. In this case, the accelerator can be in the form of various designs, depending on the specified parameters.

A common case when using this method is the use of several channels of acceleration lines, where the beam is separated by a separator, often electromagnetic, into separate beams that collide with the target in different chambers [5]. Thus, to calculate the nuclear effective cross section of the reaction, it is necessary to use a special chamber with a dense insulating, more often lead shell and separate detectors. Cylindrical chamber designs are used to analyze the reaction results with the additional possibility of studying the Rutherford scattering effect [6—7].

Based on this, it is clearly seen that these reactions require a sufficient amount of time to prepare and direct the corresponding energy costs. Therefore, sufficient preparatory time, material and energy costs are required to study the interaction of beams with target nuclei in various combinations [9—10; 15]. After the experiment, the results are processed using the available theoretical analysis methodology, which is described in many research papers [11—12]. However, in order to accelerate research work in the field of nuclear reactions, a new approach is needed that outputs results when certain initial and boundary conditions change — the parameters of the accelerator, beam and target, therefore, the creation of a new approach that accelerates the obtaining of results in nuclear reactions is relevant.

A separate problem today is the complexity of studying a new type of reaction, resonant nuclear reactions. Such reactions can be carried out on accelerators with high beam monochromacy [13]. So today, on cyclotrons, synchrotrons, phasotrons, and linear accelerators, monochromaticity reaches 5 keV at a beam energy of 20 MeV [14—15; 18]. An increase in this degree is possible with rigid separation, which leads to a large loss of beam current by 70—80% [16; 19—20]. Van de Graaf accelerators with a beam monochromaticity of 1 keV at the same maximum beam energy are considered the most accurate [15—17; 21].

An increase in this degree is possible with a more accurate selection of energy using nano-electrodes and special monochromotic devices that are at the design stage [18; 22]. However, it is important to create a mathematical model beforehand that allows not only predicting the implementation of nuclear reactions, but also all their varieties, including resonant nuclear reactions with great accuracy. Based on this, the task is also relevant.

Materials and methods of research

In the course of the research, the method of solving boundary and initial conditions in the form of accelerator system parameters, the method of classification, analysis, and mathematical modeling was used.

Research

The analysis of nuclear reactions can be carried out in a variety of ways and using different algorithms; however, the purpose of the analysis remains unchanged — to create a complete picture of the analyzed nuclear reaction. In the early analysis model [1], initially one nuclear reaction was isolated, one specific channel of it was analyzed — its energy characteristic, nuclear effective cross-section, percentages and other parameters were determined, and only after the study moved to the stage of analyzing other channels of the nuclear reaction, and at the same time the initially analyzed channel remained isolated. Each time, the chosen channel in the exo-energy reactions had a large nuclear effective cross-section, which seemed inexplicable.

The problem was that the initial channel was selected more often for the energy of the Coulomb barrier, as a result, it was observed that the reaction was carried out in an area with a large percentage, which turned out to be the main channel with a large reaction yield, since the main criterion for selected nuclear reactions in early analyses relative to the previous algorithm was the efficiency in the reaction output. In the new model of reaction analysis, the solution to this problem plays a special role, presented in the following form.

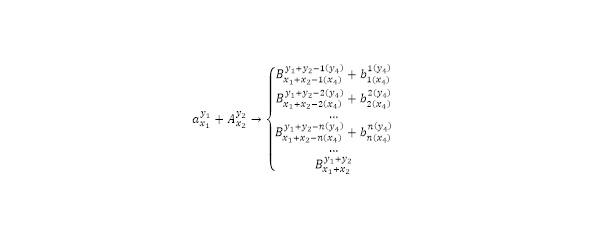
Suppose that a nuclear reaction c with its own channels (1) is initially set.

Which can also be converted to (2).

Initially, the analysis assumes the determination of the radius of the target core being bombarded (3), in order to further determine the Coulomb incoming barrier (4).

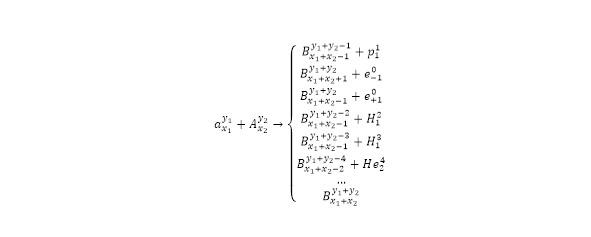
After determining the Coulomb incoming barrier, which can most often be higher than the threshold of a nuclear reaction, the energy of the incoming particle is determined, and as the energy approaches, it becomes possible to increase the probability of a larger number of nuclear reactions. However, in each case, more than one nuclear reaction channel is considered (1), among which there are reaction channels that are maximally probabilistic (5).

Such channels include channels with outgoing elementary particles or relatively light nuclei, among which one can single out a proton as the nucleus of a hydrogen atom, a deuteron and a triton as the nuclei of deuterium and tritium, respectively, as well as alpha particles.

But also, together with the above-mentioned probabilistic reaction channels, it is possible to carry out reactions with the departure of lighter reactions if, compared with heavy nuclei, the departing nucleus is with sufficiently small masses, however, it is the channels with the departing particles in (5) that are most often determined. In the early analysis, the situation with energies not reaching the surface was not considered. the value up to the Coulomb barrier, however, in this case, if necessary, this moment is considered.

To study this variation, a Rutherford scattering variant is demonstrated, where the scattering angle (6) is initially determined, which determines the ratio from the cross-sectional area of the incident beam to the total area of a sphere with a radius equal to the beam radius, which makes it possible to determine in steradians the angle from which the beam is directed towards the core, demonstrating a one-sided The direction of the beam is different than in the cases of special accelerators with multiple accelerator systems, which include a system for starting a thermonuclear reaction with a large angle.

Also, at the same time, the boundary velocity of the incoming beam (7) is determined, which is calculated on the condition that the energy of the beam is exactly equal to the energy of the Coulomb barrier, as a result of which, after passing, the particle simply would not have kinetic energy left.

In addition to the factor of determining the boundary velocity, it is worth adding that the beam velocity cannot be exactly equal to the boundary velocity due to the impossibility of ensuring zero monochromatization in the accelerator, as well as due to the law of the impossibility of having zero kinetic energy in particles. After determining the necessary ratios in (6—7), they are substituted into the expression for calculating the effective cross section, which is derived in equation (8).

Along with this, in order to determine the minimum distance between the incoming beam and the core (10), an additional parameter of the electromagnetic diameter of the core (9) is calculated.

Thus, as a result of the initial part of the analysis, it was possible to determine the effective cross-section, which is measured in bars (8) and represents the probability of a barrier with the calculation of the distance at which the incoming particle approaches the nucleus without interacting with it (10). The data determined in this way is quite exhaustive to describe a situation where elastic interaction between particles is carried out without entering into a reaction. The only exceptions are thermonuclear reactions, in which, due to universal ionization and a number of other factors, the presence of the Coulomb barrier is ignored, acting according to separate private algorithms.

In this analysis, the situation with the incoming particle beams in the accelerator is considered, as a result of which the probabilities can be determined according to the previously presented patterns. After all possible channels of nuclear reactions have been identified, but most often more probabilistic in the first degree with the release of light particles, the output of such channels (11) and the thresholds of such reactions (12) are calculated.

After the reaction channel is calculated in each of the cases, the second-degree probabilistic channels of nuclear reactions can be determined. Such channels have a positive output of nuclear reactions, that is, they are exo-energetic, if any, or if all reactions are endo-energetic, then, provided that the required energy level is reached by the incoming beam to satisfy such a reaction, that is, if there is a possibility of releasing the energy that the reaction takes, the probability of the reaction it is distributed between them.

Determining the output of the reaction channels allows not only to characterize each of the channels, but also to determine the probability of what percentage of the total set of particles will be directed to implement one or another probabilistic nuclear reaction channel. This probability can be determined by (13) as a percentage, but in the future, in each of the cases, the nuclear effective cross-section of each of the nuclear reaction channels must be determined, for which the density of the target nuclei (14) is initially calculated, which is the number of target nuclei per cubic meter, which can be It is defined as the ratio of the target density to the mass of the nuclei in kilograms.

In the classical form of the analysis, the derivation of the expression was partially presented, the relationship between the initial number of incoming particles in the beam to the number of particles involved in the reaction and in which the target thickness and nuclear density (14) are involved, together with the value of the nuclear effective cross-section, which can also be derived in (15).

Thus, for each of the channels, a certain set is calculated in the form of a sequence of values of the nuclear effective cross section (16).

Each of these values is determined directly for the case when the energy of the impinging particle is directly selected for one or another channel to which the value of the nuclear effective cross-section belongs in the sequential set (16). It is worth noting that each of the values of the nuclear effective cross-section divides the line of values in bars into certain areas. So, in order to determine exactly the situation with the nuclear effective cross-section and the percentage distribution in the case of strictly defined energy values in this case, it is necessary to act according to a different algorithm, which in this system will restore order in the case when the nuclear effective cross-section in the case under consideration falls into one of the areas, which makes this area into which The value was more probabilistic in the immediate case under consideration.

Thus, in order to achieve the optimal case, the energy of the incident particle is chosen as the sum of the Coulomb incoming barrier and a certain value, which makes the beam energy equal to the value that the accelerator can achieve with its own monochromatic value (17).

Then, after determining the energy (17), the velocity of the particle (18) is calculated, which cannot be confused with the boundary values of velocity, as can be seen from the formula, after which this value is substituted into the expression of momentum (19) according to the theory of relativity with known mass values, due to sufficiently large velocity values, and after which this value is inserted into the expression definitions of the de Broglie wave (20) for an incoming particle.

After the necessary components are determined, the nuclear effective cross-section (21) can be calculated, which is an area larger than the cross-section of the nucleus and in which the incoming particle also interacts without even touching the nucleus.

Then, after that, the percentage (22) belonging to the maximum percentage value can be determined, taking into account the factor that the numerator refers to the number of particles that did not interact.

And now, to determine which channel of a nuclear reaction such a reaction belongs to, the effective cross-section calculated in (21) is substituted into a certain area, into which the area of nuclear effective cross-sections was previously divided, and the implemented channel with the calculated percentage ratio (22) is the channel defined by the pattern (23).

Thus, a set with positive nuclear effective cross-sections can be found by applying a special operator (23) for such a general set, according to regularity (22), resulting in the most probable values of the nuclear effective cross-section.

However, in this case, when the percentage ratio for the main reaction channel is determined, the remaining percentages are determined according to the ratios of the outputs of their channels. So, if the percentage ratio and the nuclear effective cross-section coincided with the first reaction channel, then the percentages of the following channels are determined, from where it is easy to calculate their nuclear effective cross-sections (25).

In addition, the percentage ratio with the changes made is sufficient to represent new separating percentages with new values of the additional nuclear effective cross-sections of each of the channels, for the case under direct investigation, showing probabilistic reactions with their nuclear effective cross-sections (26).

Thus, part of the analysis of the reaction initiation case is completed and after that it is necessary to pay attention to the further development of the reaction. So, after the reaction, most often, even among the probable channels, radioactive nuclei may be present, which must also be analyzed as decaying, in the form of their own long channels (27), most often with light escaping nuclei, as was done in (5).

For each of the channels, the reaction output (28) is determined, which, due to the index, should not be mixed with (11), from where a new system of probabilistic nuclear reaction channels (29) is compiled using the same algorithm to determine the positive values of the outputs for each of the reaction channels.

Most often, during this stage of analysis, only those channels remain, as a result of which stable nuclei and stable outgoing light particles or light nuclei remain, each of which will be produced. And to determine the percentage ratio, (13) is used for the present case, as a result of which it is possible to determine the percentage ratio, which will not be changed due to the absence of an incoming particle with the choice of new versions of the probability values of each of the channels of nuclear radioactive decay.

As a result of the transformations obtained and the results regarding the probabilistic channels of the nuclear reaction, according to the latest model (26) and the probabilistic channels of the reaction for the radioactive nucleus (29), the kinetic energies for the nuclei and outgoing particles in (30—37) can be calculated according to certain patterns.

After the kinetic energies for each of the nuclear reaction products have been determined, as probabilistic for the main channel and probabilistic for the decay channels of radioactive nuclei, it is necessary to present the distribution according to the currents of incoming beams and products of each of the reaction channels. To do this, it is initially assumed to determine the previously calculated beam cross-section (38), from which it is possible to deduce from the formula for the beam current the amount of incoming particles (39), which was not previously determined during the calculation of percentages and the nuclear effective cross-section for the analyzed case.

During the analysis of the reaction situation, the incoming beams have a certain amount of current, set initially and most often limited by the capabilities of the accelerator system, from where it becomes possible to determine the number of incoming particles (39) and from where it is possible to determine the total charge of the incoming beam (40).

Finally, after the percentage distributions have been made, the probable channels with their nuclear effective cross-sections, the kinetic energies of the reaction products and the number of incoming particles have been determined, it is possible to fully present a model of the distribution of incoming particles in a variety of all channels, including in a variety of probabilistic channels of radioactive decay, from where it is possible to determine according to previously determined kinetic energies reaction products, exact quantitative ratios (41).

Thus, after analyzing the quantitative ratio, it becomes obvious that the elementary particles will simply leave the resulting split core, where the droplet model of nuclear reactions is most often used. The parameters of the outgoing particles, along with their number, kinetic energies, and beam cross sections, which are partly equal to (38), are obvious.

It remains to analyze the situation with the remaining cores. One of the main indicators required for determination is the variable temperature of the formed nuclei as a result of the nuclear reaction, which can be determined from the total energy of the components, which can be represented as the products of the energies of each of the nuclei together with the number of nuclei formed, resulting in the total energy of the nuclei of each of the nuclear reaction channels (42).

Since each of the reaction channels is carried out in a certain percentage during the reaction, from this it is possible to determine the total energy as the sum of the energies of the forming nuclei (43), in cases when particles fly out of them and do not fly out, which may be useful for determining the temperature in (47), for which it is necessary to determine the quantitative ratio with the specific heat capacity of the plate to its mass, for which its volume (44) is determined, and from there the initial mass (45) is determined from the density value, However, since the plate consumed part of the nuclei to carry out the nuclear reaction, it is necessary to determine the resulting mass [46].

Thus, as a result of the reaction, the necessary particular characteristic for the nuclei has been determined, along with their number, mass, and temperature, however, we will have to return to this issue, since this is precisely the internal temperature, but it is worth paying attention to the outgoing particles now. Each of the outgoing particles in each of the reaction channels has its own total charge for each of the beams (48) with its own velocities (49) and currents (50).

Before starting the reaction, the input Coulomb barrier was determined, after which various internal indicators began. Now that each of them is known, it remains to determine the output results, which can be represented as an outgoing Coulomb barrier (52), with the radii of each of the formed nuclei (51).

It should be noted here that the outgoing Coulomb barrier, according to experimental data, almost always acts in cases when the outgoing particle has a positive charge, exactly like the nucleus and quite rarely in cases with negative charges. So, when the nucleus and the outgoing particle have the same charge, the kinetic energies add up, in the opposite cases they should reach each other, however, according to the resulting work, it is necessary to postulate that in most cases, such an addition is extremely rare for a charge of different names.

Along with the above, it is also impossible to say that there are no nuclear reactions carried out in which there would be no energy negation of the outgoing particle, which may be one of the topics of further research. However, one should not discount the possibility of an explanation using existing nuclear models, for example, a drop or shell model of the nucleus. The first described case with charges of the same name for the energies of outgoing particles with an outgoing Coulomb barrier can be defined as the sum in (53).

From the energy expression obtained, it is possible to determine the velocity of the outgoing particle (54) with their own currents (55).

Now, it only remains to return to the issue of the energies of the formed nuclei, which also have changed energies (56), from where we can calculate the value for the changed total energy (57), and therefore the temperature (58).

As a result, all the necessary results that needed to be determined were identified. Thus, we can say that the nuclear reaction (1) with all its reaction channels has been fully analyzed.

Results

As a result of the analysis, the following conclusions are drawn:

1. The condition of the task: a nuclear reaction of the form (2.1) was investigated with initially specified parameters in the form of the kinetic energy of the directed beam and the mass of all participating particles in the nuclear reaction in a. e. m.;

2. During the Rutherford scattering analysis, strictly defined results were achieved in the form of the value of the nuclear effective cross section and the maximum distance convergence at critical velocity with the nucleus and the incoming particle;

3. Directed beams consume a certain amount of energy to overcome the Coulomb barrier, having residual energy — it’s found value is indicated.;

4. A list of the outgoing particles from the main channel of the nuclear reaction is made, including various groups of gamma rays, if any, indicating the kinetic energy (where, if necessary, their classification by energy is also compiled), the charge and current of each of them.;

5. If the formed particles can probabilistically interact (similar to the annihilation of positrons and electrons), then this is indicated and an additional list with all relevant accounts is provided.;

6. In accordance with each reaction, a list is provided with all the work performed in Joules and capacities in Watts for each type of radiation with all the components, along with the number of nuclei formed, their masses, other additional results and energy values;

7. The general conclusions on the objectives of this study are indicated — the general study / generation of electrical energy / establishment of conclusions on some precise aspect, etc., as well as conclusions in the relevant area: the amount of energy generated, conclusions on the necessary aspect, general scientific data, conclusions, etc.

Thus, based on mathematical analysis, the energies of the formed particles and their nature of origin are calculated. Nuclear reactions with bombarding charged particles with high and low kinetic energies of target nuclei, as well as the resonance state of these nuclear reactions, have been studied. The present method and algorithm is currently new with the results coming out.

Conclusion

Based on the theoretical calculations carried out, it is indicated that using the proposed analysis methods it is possible to obtain certain results that correlate with experimental data with a small error. At the same time, the use of the obtained model makes it possible to simulate the implementation of various types of nuclear reactions with bringing to a state of resonance. At the same time, the best variations can be selected among them, preserving their best efficiency, while maintaining maximum currents and energies of the outgoing beams, capable of further use through MHD generation. Thus, the proposed technique is a new approach to studying the nuclear interactions of high-energy particles with stationary target nuclei, considering the full-fledged effectiveness of each of the nuclear reaction channels, their own resultant parameters for each of the reaction products, and other data.

References

1. Aliev I. X., Sharofutdinov F. M. The use of accelerators and phenomena of collision of elementary particles with high-order energy to generate electrical energy. The «Electron» project. Electronic Laboratory LLC. The scientific school «Electron». Publishing solutions. The Ridero. 2021. — 594 p.

2. Aliev I. X. New parameters for nuclear reactions to be carried out at an LCU-EPD-300 type charged particle accelerator. The «Electron» project. Electronic Laboratory LLC. The scientific school «Electron». Publishing solutions. The Ridero. 2022. — 598 p.

3. Aliev I. X. Collision energy of oncoming beams. A young scientist. International Scientific Journal. Part No. 16 (306) /2020. ISSN 2071—0297. Publishing house «Young Scientist». 2020. 7—10 p.

4. Aliev I. X. Linear electron accelerator in power engineering. Exact science. Issue No. 85. The publishing house «Pluto». ISSN 2500—1132. 2020. 23—29 p.

5. Aliev I. X. Electron and its features. Exact science. Issue No. 63. The publishing house «Pluto». 2019. 37—39 p.

6. Aliev I. X. On a heuristic idea about the emergence of a new energy technology for obtaining energy from resonant nuclear reactions. International scientific journal «All Sciences». SRI «PRNR». Scientific school «Electron», Electron Laboratory LLC. Ridero. No. 1, 2022. 13—18 p.

7. Aliev I. X. Aluminum resonant nuclear reaction. International scientific journal «All Sciences». SRI «PRNR». Scientific school «Electron», Electron Laboratory LLC. Ridero. No. 3, 2022. 24—44 p.

8. Aliev I. X. On the types of charged particle injection systems in accelerator technology. International scientific journal «All Sciences». SRI «PRNR». Scientific school «Electron», Electron Laboratory LLC. Ridero. No. 4, 2022. 14—25 p.

9. Aliev I. X., Karimov B. X. Development of vacuum technologies in accelerator technology. International scientific journal «All Sciences». SRI «PRNR». Scientific school «Electron», Electron Laboratory LLC. Ridero. No. 4, 2022. 41—55 p.

10. Aliev I. X., Jalolov B. R., Karimov B. H. The role of resonant nuclear reactions in modern energy. The role of resonant nuclear reactions in modern energy. International scientific journal «All Sciences». SRI «PRNR». Scientific school «Electron», Electron Laboratory LLC. Ridero. No. 6, 2022. 50—113 pp.

11. Aliev I. X., Sharofutdinov F. M. On modern achievements in physics of resonant accelerator installations. International scientific journal «All Sciences». SRI «PRNR». Scientific school «Electron», Electron Laboratory LLC. Ridero. No. 8, 2022. 15—21 pp.

12. Aliev I. X., Karimov B. X. Physics of charged particle accelerators. The training manual. SRI «PRNR». Scientific school «Electron», Electron Laboratory LLC. Ridero. — 203 p.

13. L. Coragio, G. De Gregorio, T. Fukui, A. Gargano, Y.Z. Ma, Z.H. Cheng, F.R. Xu. The role of three-nucleon potentials in the shell model: past and present. Progress in particle physics and nuclear physics. Volume 134, January 2024, 104079.

14. Agnieszka Sorensen, Krziti Agarwal, Kyle W. Brown, Zbigniew Chaecki and others. The equation of state of dense nuclear matter after collisions of heavy ions. Progress in particle physics and nuclear physics. Volume 134, January 2024, 104080.

15. Stefan Diehl. Experimental study of the three-dimensional structure of nucleons. Progress in particle physics and nuclear physics. Volume 133, November 2023, 104069.

16. Gert Arts, Jorg Eichelin, Chris Allton, Andreas Athenodorou and others. Phase transitions in elementary particle physics: results and prospects of quantum chromodynamics of the crystal lattice.

17. M. Pfutzner, I. Mucha, S.M. Wang. Two-proton emission and related phenomena. Progress in particle physics and nuclear physics. Volume 132, September 2023, 104050.

18. Christian Graff, Lennart Volz, Marco Durante. New technologies for cancer treatment using accelerated particles.

19. Shanshan Cao1 and Guang-Yu Qin. The reaction of the medium and the correlation of the jet and hadron in the collision of relativistic heavy ions. Annual review of the science of the nucleus and elementary particles. Volume 73: 205—229 (volume publication date — September 2023) was first published as a preliminary review on July 17, 2023.

20. Lena V. Gast, Tanya Platt, Armin M. Nagel, Teresa Gerhalter. The latest technical developments and clinical studies of the use of MRI with sodium (23Na). Progress in nuclear magnetic resonance spectroscopy. Volumes 138—139, November–December 2023, Pages 1—51.

21. Claudio Dahlwit, Isabelle Gmur, Philip Ressler, Alvar D. Gossert. Determination of the affinity of strong ligands using NMR spectroscopy: limitations and ways to overcome them. Progress in nuclear magnetic resonance spectroscopy. Volumes 138—139, November–December 2023, pages 52—69.

22. Sandeep Kumar Mishra, N. Suryaprakash. Pure shift has edited the NMR methodology to isolate homo- and heteronuclear compounds with ultra-high resolution. Progress in nuclear magnetic resonance spectroscopy. Volumes 136—137, August–October 2023, Pages 1—60.

MATEMATIK MODELLASHTIRISH YORDAMIDA EKSPERIMENTNI REJALASHTIRISH. ПЛАНИРОВАНИЕ ЭКСПЕРИМЕНТА С ИСПОЛЬЗОВАНИЕМ МАТЕМАТИЧЕСКОГО МОДЕЛИРОВАНИЯ. PLANNING AN EXPERIMENT USING MATHEMATICAL MODELING

UDK: 51—07

Mamatova Zilolaxon Xabibulloxonovna

Farg‘ona davlat universiteti dotsent pedagogika fanlari bo‘yicha falsafa doktori (PhD)
Orcid: 0009-0009-9247-3510

E-mail: mamatova.zilolakhon@gmail.com

Annotatsiya: Ushbu maqolada eksperimentni rejalashtirishning asosiy tamoyillari va jarayonlari tahlil qilingan. Maqolada eksperimentning maqsadga muvofiq o’tkazilishi uchun zarur bo’lgan bosqichlar, shu jumladan, tadqiqotning maqsadini aniqlash, o’zgaruvchilarni tanlash, tajriba shartlarini yaratish va natijalarni tahlil qilish bo’yicha tavsiyalar berilgan. Eksperimentni rejalashtirishda ilmiy metodologiyalarga, tasodifiylik va aniqlik prinsiplarga asoslangan yondoshuvlar ko’rsatilgan. Shuningdek, maqolada ilmiy tadqiqotlar va amaliyotda eksperimentlarni muvaffaqiyatli tashkil etish uchun zarur bo’lgan texnik va metodik yondashuvlar ham ko’rib chiqilgan.

Kalit sozlar: statistika, tajriba, kuzatuv, miqdor, reja, ishdan chiqmaslik, ekspluatatsiya, rejalashtirish.

Аннотация: В данной статье анализируются основные принципы и процессы планирования эксперимента. В статье даны рекомендации по действиям, необходимым для проведения эксперимента в соответствии с целью, включая определение цели исследования, выбор переменных, создание условий эксперимента и анализ результатов. При планировании эксперимента показаны подходы, основанные на научных методологиях, принципах случайности и точности. Также в статье рассмотрены технические и методические подходы, необходимые для успешной организации экспериментов в научных исследованиях и практике.

Ключевые слова: статистика, опыт, наблюдение, количество, план, неудача, эксплуатация, планирование.

Abstract: This article analyzes the basic principles and processes of experiment planning. The article provides recommendations for the steps necessary for conducting the experiment in accordance with the purpose, including determining the purpose of the study, choosing variables, creating experimental conditions, and analyzing the results. Approaches based on scientific methodologies, principles of randomness and accuracy are shown in the planning of the experiment. Also, the technical and methodological approaches necessary for the successful organization of experiments in scientific research and practice are considered in the article.

Key words: statistics, experience, observation, quantity, plan, failure, exploitation, planning.

Kirish

Eksperiment — ilmiy tadqiqotlar va amaliy ishlarni o‘tkazishda asosiy metodlardan biri bo‘lib, tizimli va maqsadga yo‘naltirilgan tajribalar orqali o‘zgaruvchilar o‘rtasidagi bog‘lanishlarni aniqlash imkonini beradi. Eksperimentni muvaffaqiyatli o‘tkazish uchun esa uning rejasi puxta ishlab chiqilishi lozim. Rejalashtirish jarayoni ilmiy tadqiqotning barcha bosqichlarida aniq yo‘nalishlarni belgilash, tajribani to‘g‘ri tashkil etish va natijalarning ishonchliligini ta’minlash uchun zarurdir. Eksperimentni rejalashtirishda maqsad, o‘zgaruvchilar, shartlar, metodlar va usullarni aniq belgilash, tajribada uchraydigan xatoliklar va tasodifiy omillarni hisobga olish muhim ahamiyatga ega. Maqolada eksperimentni rejalashtirishning asosiy prinsiplari, uning samarali tashkil etilishi uchun zarur bo‘lgan bosqichlar va metodik yondoshuvlar tahlil qilinadi. Bu bilimlar, o‘z navbatida, ilmiy izlanishlarni o‘tkazishda va amaliyotda to‘g‘ri va aniq natijalarga erishish uchun katta ahamiyatga ega bo‘ladi. Shuningdek, maqolada eksperimentlarni muvaffaqiyatli tashkil etish uchun texnik va metodologik tavsiyalar ham beriladi.

Adabiyotlar tahlili

Eksperimentni rejalashtirish bo‘yicha adabiyotlar tahlili, ilmiy tadqiqotlarning samarali o’tkazilishi uchun zarur metodlarni va yondoshuvlarni aniqlashga yordam beradi. K. Popperning «Ilmiy bilimlar nazariyasi» (1972) asarida ilmiy eksperimentning asosiy falsafiy prinsiplari, tasodifiylik va nazariyalarni tekshirishdagi o‘rni ko‘rsatilgan. S. R. Kogan «Eksperiment metodologiyasi» (2006) asarida eksperimentlarni rejalashtirishda tasodifiylik va nazorat guruhlari ahamiyatiga to‘xtalgan. M. N. Belyaevning «Statistika va eksperiment» (2010) asarida statistik usullar orqali eksperiment natijalarini tahlil qilish va xatoliklarni kamaytirish metodlari keltirilgan. S. K. Davydov «Ilmiy tadqiqot metodologiyasi» (2015) asarida eksperiment shartlarini aniq belgilash va natijalarni qayta tekshirishning zarurligi haqida yozgan.

Tadqiqot metodologiyasi

Ushbu tadqiqotda eksperimentni rejalashtirishning asosiy tamoyillari va metodlari o‘rganiladi. Tadqiqotning metodologik yondoshuvi empirik va nazariy tahlilni o‘z ichiga oladi. Maqsad eksperimentni samarali o‘tkazish uchun zarur bo‘lgan bosqichlarni aniqlash va ularning ilmiy asoslarini tushunishdir. Tadqiqot jarayonida adabiyotlar tahlili orqali eksperimentni rejalashtirish va o‘tkazish bo‘yicha mavjud ilmiy manbalar o‘rganiladi. Bu manbalar metodik yondoshuvlar va tajriba o‘tkazishning samarali usullarini ko‘rib chiqishga imkon beradi. Komparativ tahlil orqali turli metodologik yondoshuvlar solishtiriladi va ularning afzalliklari aniqlanadi, masalan, tasodifiylik, nazorat guruhlari va statistik tahlil usullari. Eksperimental tahlil esa nazariy asosda yaratilgan tajribalar va sinovlar orqali eksperimentni rejalashtirish jarayonlarini tekshirish va amaliyotda qo‘llashni o‘z ichiga oladi. Kvalitatif tahlil metodik jihatlarni, shartlarini va natijalarini sifat jihatidan tahlil qilishga qaratilgan bo‘lib, ilmiy jihatdan to‘g‘ri rejalashtirilgan eksperimentlarning muvaffaqiyatli o‘tkazilishiga e’tibor qaratiladi. Tadqiqot metodologiyasi eksperimentning barcha bosqichlarini puxta rejalashtirish, natijalarni tahlil qilish va ilmiy ishonchli xulosalarga kelish uchun zarur bo‘lgan yondoshuvlarni aniqlashga qaratilgan. Bu metodlar yordamida eksperimentni o‘tkazishda uchraydigan xatoliklarni kamaytirish va ishonchli natijalar olish mumkin.

Tahlillar va natijalar

Tajribalarni rejalashtirish tadqiqot qilinayotgan tizimni formal modellash va bu tizimning asosiy qonuniyatlarini adekvat statistik modellar darajasida yozib chiqishni o‘z ichiga oladi.

An’anaviy bir omilli tajriba y=f (x) ko‘rinishidagi bog‘lanishni tadqiqot qilishga asoslangan bo‘lib, bunday tajriba vaqtida faqat bitta omilning qiymatlari o‘zgartiriladi. Boshqa barcha omillarning qiymatlarini o‘zgarmas holda tutib turishga harakat qilinadi.

Masalan, mashinaning ishlashiga faqat uchta omil ta’sir ko‘rsatadi deb olib, har bir omilni o‘rganishda uning o‘nta qiymati uchun tajriba o‘tkazsak, tajribalarni kamida besh martadan takrorlasak, barcha tajribalar soni N = 3×5×10 = 150 ta bo‘ladi. Natijada 10 tadan nuqta bo‘yicha qurilgan 3 ta grafikka ega bo‘lamiz. Har bir grafik alohida omilning mashina ishlashiga ta’sirini ifodalaydi va ularning funktsiyalari ushbu ko‘rinishga ega bo‘ladi:

Bunday funktsiyalarni umumiy ko‘rinishga keltirish, ya’ni u=f (x1) +f (x2) +f (x3) =f (x1,x2,x3) deb yozish noto‘g‘ri bo‘ladi, chunki har bir omilning funktsiyasi boshqa omillarning o‘zgarmas qiymatlari uchun aniqlangan.

Traktorlarning ishlashiga faqat uchta emas, balki cheksiz ko‘p omillar ta’sir ko‘rsatishi mumkin. Ko‘plab omillarning bir vaqtning o‘zidagi tizim ishlashiga ta’sirini tajribalarni statistik rejalashtirish orqali aniqlash mumkin. Bunga oid bir misolni ko‘rib o‘tamiz.

Qandaydir material (masalan, murakkab legirlangan qotishma) tarkibini, uning mexanik xossalariga ta’sirini o‘rganish talab etiladi. Masalani bunday ko‘rinishda tasavvur qilamiz: legirlovchi elementlar tizimi berilgan va qotishmadagi elementlarning, material optimal xossalarga ega bo‘lishini ta’minlaydigan, miqdorini topish kerak.

Elementlarning qotishmadagi miqdorini x1, x2,¼, xn bilan belgilaymiz, ularni tizimni va uning xossalarini aniqlovchi mustaqil omillar deb hisoblaymiz. Materialning tekshirilayotgan xossasi y1, y2,¼, ym bo‘lsin (tizimning javob funktsiyasi atamasi ishlatiladi).

Bunday belgilanishlarda yangi material ishlab chiqish masalasi (2) funksiyalar tizimini olinishi, tadqiqoti va bu tizim yechimini birmuncha optimallash masalasi sifatida ko‘rsatilishi mumkin.

Yana ikkita tushunchani aniqlab olamiz. ularni ikki elementdan tashkil topgan materialning bitta xossasi tekshirilayotgan oddiy holat ya’ni, tekshirilayotgan tizim funksional bog‘lanishga keltiriladigan misolda ko‘ramiz.

Umumiy holda 1-rasmda keltirilgan xildagi (N+1) -o‘lchovli sirtlar tizimi mavjud deb olinadi. bu sirtlarni javob sirtlari deb, 1-rasmdagiga o‘xshash chiziqlar tizimini esa daraja chiziqlari deb ataladi.

Yangi materiallarni tadqiqot qilishda javob sirtlari tavsifi va daraja chiziqlari shakli noma’lum bo‘ladi. tajriba o‘tkazayotgan kishi, odatda legirlovchi elementlar miqdorini ketma-ket o‘zgartirish va olingan natijalarni taqqoslash usullaridan foydalanib, yuqoriroq xossalar sohasi yo‘nalishida harakatlanadi.

1-rasm. Tizimning javob sirti va teng daraja chiziqlari

Bu usullarning javob funktsiyasi ekstremumini qayd etishga nisbatan muhim kamchiliklarini ko‘rsatamiz.

1. Xossalarning haqiqiy maksimal sohasiga (javob funktsiyasining qat’iy ekstremum sohasiga) chiqish ehtimoli nisbatan kichik.

2. Omillar soni oshib borganda bu ehtimollik kamayadi, oxirida nolga intiladi. (Omillarni ketma-ket o‘zgartirish usuli bilan optimumga borishni «labirint bo‘ylab harakat» deb atalishi ham tasodifiy emas).

3. Xossalarning eng yuqori sohasini topish uchun amalga oshirish zarur bo‘lgan tajribalar sonini oldindan baholash va tartibini belgilash qiyin. Odatda, bu son juda katta bo‘ladi.

Matematik statistika xossalar maksimumi sohasiga ishonchli chiqadigan tadqiqot usullarini taklif etadi. Bunda tadqiqot qilinadigan tajriba tarkiblari soni nisbatan ko‘p bo‘lmaydi.

Buning uchun tadqiqotlarning boshlashda bir vaqtning o‘zida bir nechta tajribaviy quyma quyish taklif etiladi. Tajribalarda legirlovchi elementlar miqdori, tajriba rejasi deb ataluvchi, belgilangan qoida bo‘yicha tanlanadi. Quymalar soni N legirlovchi elementlar soni n ga, ularning o‘zaro ta’siri xarakteriga, boshqa ba’zi fikrlarga bog‘liq bo‘ladi va n=2¸3 uchun N=4; n=3¸7 uchun N=8; n=4¸14 uchun N=16 tadan iborat.

Tajriba rejasi, tajriba boshlanishida olingan ma’lumotlarga statistik ishlov berish ushbularga imkon yaratadigan qilib tuziladi.

1) tajribalarning boshlang‘ich sohasida aniqlangan xossalarga nisbatan yuqoriroq xossalar sohasi mavjudligini va holatini baholash;

2) yuqoriroq xossalar sohasiga chiqish tezroq amalga oshiriladigan, kimyoviy tarkib variantlarini ko‘rib chiqishning samaraliroq usulini aniqlash;

Kimyoviy tarkib variantlarini ko‘rib chiqishning bunday usuli, javob sirti gradientining yo‘nalishi bilan mos kelgan usul hisoblanadi.

Gradient bo‘ylab harakatning samaradorligi, eng avvalo, tajribadan tajribaga birdaniga barcha legirlovchi elementlaring tarkibi belgilangan nisbatda o‘zgarishi bilan aniqlanadi. n ³ 5¸7 voqealar uchun bu shunday samara beradiki (legirlovchi elementlar tarkibini ketma-ket o‘zgartirish usuli bilan taqqoslaganda) tadqiqotlarning umumiy muddati bir necha marta qisqaradi.

Xulosa

Eksperimentni rejalashtirish ilmiy tadqiqotlar va amaliy izlanishlarning muvaffaqiyatli o‘tkazilishida asosiy ahamiyatga ega. Tadqiqotda eksperimentni samarali o‘tkazish uchun zarur bo‘lgan metodologik yondoshuvlar, masalan, adabiyotlar tahlili, turli metodologik usullarni solishtirish, tajriba shartlarini aniqlash va natijalarni tahlil qilish jarayonlari ko‘rib chiqildi. Eksperimentni to‘g‘ri rejalashtirish, natijalarni aniq va ishonchli baholash imkonini yaratadi, xatoliklarni kamaytirishga yordam beradi. Shuningdek, tasodifiylik, nazorat guruhlari va statistik metodlarning muhimligi ta’kidlandi. Tadqiqotda ilgari surilgan metodlar ilmiy izlanishlar uchun to‘g‘ri yo‘nalishlarni belgilab, eksperimentning samarali va aniq o’tkazilishiga asos bo‘ladi. Maqola eksperimentni muvaffaqiyatli rejalashtirishning ilmiy jihatdan to‘g‘ri yondoshuvlar bilan amalga oshirilishini va bu orqali ishonchli natijalarga erishishni ta’kidlaydi.

Foydalanilgan adabiyotlar

1. Popper K., «Ilmiy bilimlar nazariyasi», Toshkent, Fan, 1972, 45-bet.

2. Kogan S. R., «Eksperiment metodologiyasi», Moskva, Nauka, 2006, 78-bet.

3. Belyaev M. N., «Statistika va eksperiment», Toshkent, Iqtisodiyot, 2010, 92-bet.

4. Davydov S. K., «Ilmiy tadqiqot metodologiyasi», Moskva, Pedagogika, 2015, 102-bet.

5. Karimov T., «Eksperiment va uning metodik yondoshuvlariga ta’sir etuvchi omillar», Ijtimoiy fanlar jurnali, 2019, 5-son, 45-56-betlar.

6. Yunusov J., «Eksperimentni rejalashtirishda nazorat guruhlari va tasodifiylik», Ilmiy tahlil, 2017, 4-son, 34-41-betlar.

7. Ismoilov I., «Tadqiqot metodologiyasi: eksperimentni rejalashtirishning asosiy tamoyillari», Toshkent, Ma’naviyat, 2018, 60-bet.

8. Sultonov B., «Populyatsiya va ekologiya: eksperimentlarni o‘tkazish metodlari», Samarqand, Sharq, 2016, 128-bet.

СОЗДАНИЕ И ИССЛЕДОВАНИЕ КОМБИНИРОВАННОЙ АВТОНОМНОЙ ЭНЕРГЕТИЧЕСКИЙ УСТАНОВКИ, СОСТОЩИЙ ИЗ МИКРОГЭС И ФОТОЭЛЕКТРИЧЕСКОЙ БАТАРЕИ

УДК: 53.07

Рустамов Умиджон

Педагог Ферганского политехнического института
Алиев Ибратжон Хатамович
Директор НИИ «ФРЯР»

alievibratzon12@gmail.com +998902913384

Аннотация. В настоящей статье представлено исследование, направленное на описание комбинированной системы гидро- и солнечной электростанции. Представлены методологии анализа графиков генерируемых мощностей в зависимости от координат расположения и времени. Каждый из них были созданы на основе решения дифференциальных уравнений, которые позволяют определить роль систем комбинирования различных энергоблоков целостной системы. Также указаны пункты практической и научной значимости исследования и приведены заключительные выводы.

Ключевые слова: комбинированная система, солнечная энергетика, гидроэнергетика, дифференциальные уравнения, построение графиков мощности.

Annotation. This article presents a study aimed at describing a combined hydro and solar power plant system. Methodologies for analyzing graphs of generated capacities depending on location coordinates and time are presented. Each of them was created on the basis of solving differential equations that allow us to determine the role of systems combining various power units of an integrated system. The points of practical and scientific significance of the study are also indicated and the final conclusions are presented.

Keywords: combined system, solar energy, hydropower, differential equations, power plotting.

Annotatsiya. Ushbu maqolada gidro va quyosh elektr stantsiyasining kombinatsiyalangan tizimini tavsiflashga qaratilgan tadqiqot keltirilgan. Joylashuv va vaqt koordinatalariga qarab hosil bo’lgan quvvat grafikalarini tahlil qilish metodologiyalari keltirilgan. Ularning har biri integral tizimning turli xil energiya bloklarini birlashtirish tizimlarining rolini aniqlashga imkon beradigan differentsial tenglamalarni echish asosida yaratilgan. Shuningdek, tadqiqotning amaliy va ilmiy ahamiyati ko’rsatilgan va yakuniy xulosalar berilgan.

Kalit so’zlar: kombinatsiyalangan tizim, quyosh energiyasi, gidroenergetika, differentsial tenglamalar, quvvat grafikasi.

Введение

Развитие в области современных исследований приводит к активному развитию в области науки, энергетики, технологий. Согласно экономическим данным мировой индустрии, потребность на энергетические показатели каждой страны с каждым днём всё больше увеличиваются. Исследования в настоящем направлении продолжаются, но при этом можно наблюдать развивающуюся тенденцию в сторону создания новых энергетических установок и электрических станций различного типа. Среди них можно выделить атомные, тепловые, но среди общего количества создающихся большинстве солнечные, ветряные и гидроэлектростанции, каждый из которых больше рассматривается в числе представителей зелёной энергетики, развивая настоящее направление [1—2]. Так, одним из новых тенденция настоящего направления стала возможность комбинирования того или иного подтипа установок.

Причиной перехода к такому решению стали изначальные особенности различных технологических систем. Так, современные технологические системы в роли солнечных батарей и сродные им на основе различных материалов в лице кристаллического, аморфного кремния или арсенида галлия, функционируют посредством преобразования солнечной энергии в электрическую [1—3]. Однако в силу неоднородности облучения планеты Земля, наблюдается явная неоднородность во всех системе солнечных панелей, в силу чего практически всегда используются аккумулирующие или подобные им системы [2; 4—5]. Ещё одним решением в этом вопросе стало использование комбинирующих систем из нескольких типов электростанции, чаще — солнечной и гидроэлектростанции, где гидроэлектростанция компенсирует недостатки солнечной и наоборот в зависимости от потока. Но при рассмотрении, к примеру, первого случая как должна описываться величина генерируемых мощностей на солнечной и гидроэлектростанции известно лишь эмпирически, но отсутствует теоретическая база, позволяющая работать с подобными комбинациями. Исходя из этого разработка математического аппарата с таковым предназначением в настоящем исследовании является актуальным.

Методы исследования

В ходе осуществлённого исследования используются методы анализа, классифицирования данных, математическое моделирование и интерполяция заданных значений.

Исследование

Согласно определённым параметрам в изначальных условиях комбинированной энергетической системы становиться ясным, что при генерации со стороны одного из источников переменной величины мощности, для сохранения стабильности системы важно компенсирование недостающей величины. При использовании единичного источника использовалась система резистивного компенсирования, где пики генерируемых величин уменьшались до усреднённых, посредством чего получалась постоянная.

Для моделирования системы действующая благодаря компенсации солнечной стации и гидроэлектростанции, необходимо использование функции, описывающая величину генерируемой мощности. Таковая функция была разработана в ходе специального исследования посредством решения дифференциальных уравнений [6], где получена соответствующая функция (1).

Настоящее выражение описывает величину генерируемой мощности на поверхности планеты в зависимости от широты, долготы, радиуса планеты и года, с учётом всех имеющихся ныне параметров Солнца. Согласно, моделированию, образуется трёхмерных график на момент 4,5 млрд. лет с времени зарождения Солнца (Рис. 1).

Рис. 1. График функции облучения планеты Земля

Следовательно, исходя из этого вывода достаточно легко определить, что должна иметься некая усреднённая, максимальная величина, равная 500 Вт/м2, для достижения которой в областях с известными величинами широты и долготы на поверхности планеты, должны генерироваться компенсирующие мощности. Таковая мощность является минимальной для генерации на гидроэлектростанции, обладающая исходя из определения своей конструкции большей возможностью для корреляции и управления с задаваемыми графиками, посредством контроля потока воды. Не менее важным условием при моделировании функции обратной генерации является фактор того, что даже при условии увеличения величины, она должна квантоваться.

Явление квантовая или дискретности величины функции с точки зрения величины обратной мощности — мощности гидроэлектростанции объясняется не только необходимостью в последующем получения целостной суммы, но и важностью в случае необходимости перехода на более высокую мощность, с разностью равная натуральному значению мощности. Исходя из указанных требований к обратной, компенсирующей величине функции, формируется её вид (2).

Так, для имеющегося случая при максимальной величине на имеющейся области Ферганской долины, образуется изначальный график (Рис. 1) и компенсирующий график при нулевой разности (Рис. 2).

Рис. 2. График мощности гидроэлектростанции

Для достижения указанных показателей на графике 2 возможно использование нескольких методов решения:

1. Механического взаимодействия с непосредственным контролем подачи потока;

2. Использование резистивных дополнительных схем;

3. Применение аккумулирующих механизмов, соединяющие общие мощности всей конструкции.

На сегодняшний день, подобный тип конструкции реализуется на исследуемой территории Ферганской долины, где используется третий метод достижения общей корреляции, с дальнейшим выпрямлением сигнала посредством трансформаторных систем, дополняющие общее качество сигнала.

Практическая и научная значимость исследования. Практическая значимость исследования подтверждается реальной проектной реализацией описываемой системы в лице комбинированной электростанции на основе солнечной и гидроэлектростанции. С теоретической или научной точки зрения сам алгоритм возможности подведения к корреляции двух или более составляющих изначально в математическом-модуляционном, а после в практическом смысле открывает широкие возможности для дальнейшего совершенствования данной схемы.

Выводы и предложения. В качестве выводов к осуществлённому исследованию можно привести факт установления эмпирически и теоретически практической эффективности системы комбинирования. Также посредством проведённых работ был получен алгоритм возможного моделирования комбинирования с иными системами и типами электростанций.

Использованная литература

1. Германович В., Турилин А. Альтернативные источники энергии и энергосбережение. Практические конструкции по использованию энергии ветра, солнца, воды, земли, биомассы. — СПб.: Наука и Техника, 2014. — 320 с.

2. Возобновляемые источники энергии. Физико-технические основы: учебное пособие / А. да Роза; пер. с англ. под редакцией С. П. Малышенко, О. С. Попеля. — Долгопрудный: Издательский дом «Интеллект»; М.: Издательский дом МЭИ; 2010. — 704 с.

3. Гидроэнергетика. Под редакцией В.И.Обрезкова: М.: Энергоатомиздат; 1981. — 608 с.

4. Альтернативные энергоносители/ М. В. Голицын, А. М. Голицын, Н. В. Пронина. — М.: Наука, 2004. — 159 с.

5. Биогаз: теория и практика. Баадер В., Доне Е, Бренидерфер М.; пер. с немецкого М.И.Серебряного. — М.: Колос, 1982. — 148 с.

6. Qo’ldashov G. O., Aliyev I. X., Abdurakhmonov S. M., Abdullaev J. S. On The Evolutionary Change In The Power Of Solar Radiation On Earth Over Time. E3S Web of Conferences. — 1—20 pp.

On The Derivation Of The Equation Of Electrical Conductivity And Mathematical Modeling Of A Semiconductor Element Based On Cadmium Telluride, Silicon Oxide And Crystalline Silicon

UDK: 537

Ibratjon Aliyev1,а), Salim Otajonov2,b) and Abdullaev Sherzod3

1Scientific Research Institute «Physics of Resonant Nuclear Reactions», 195/37, Tinchlik MFY, Margilan, Fergana region, 151100, Republic of Uzbekistan
2Fergana State University, 19, Murabbiylar Street, Fergana, Fergana region, 150100, Republic of Uzbekistan
³Fergana Polytechnic Institute, 49, Fergana Street, Fergana, Fergana region, 150100, Republic of Uzbekistan
a) Corresponding author: alievibratzon12@gmail.com

b) otajonov_s@mail.ru

Abstract. The article presents a study on the derivation of a general dynamic equation of electrical conductivity, taking into account additional external factors with the creation of a different external field. An illustrative example based on CdTe and Si semiconductors organizing a single element is also presented. To derive the corresponding equation, the method of direct derivation of the thermal conductivity equation from a partial prototype of the Helmholtz equation, followed by its reduction from the Laplace equation in electrostatic modeling, is touched upon. In conclusion, the equation itself, the boundary conditions for the specified model and the empirical data obtained during the implementation of the model are given. It was found that as an external electric field and a corona discharge are used, potential barriers between the layers of a semiconductor element as cadmium telluride, silicon oxide and crystalline silicon in the zones of depleted layers are smoothed and after heat treatment, recovery also continues.

Keywords. Statements, differential equations, electromagnetic field, differential equation, original form.

Introduction

The increase in the variety of available materials with different conductive properties and variable concentrations of free charges in them of various types opens up great opportunities for modern technical science. Among the number suitable for the above definition are semiconductors with different structures using alloying on adjacent materials [1—2; 11]. At the same time, there is also a technology for using semiconductors to create elements of the same name, where silicon can also act, with its impurities, among which pure crystalline silicon, a mixture of silicon and boron, silicon and phosphorus, as well as other combinations of semiconductors can act [2—4; 7—12; 15—16].

When using several elements of the type p-n, n-p, p-n-p and n-p-n, it is necessary to model a situation that could describe the selected case using the appropriate equations. To date, empirical work in this vein has been actively applied [5—10; 12—16], including with the direct use of quantum modeling systems, which take into account the effects of tunneling, partial creation of entangled electrons and other quantum effects following from known patterns [2; 7—11; 14—15]. Similar work has also been carried out previously in the framework of studies on CdTe-SiO2-Si [2—6; 8], which is also mentioned in this study. However, in each of the presented cases, the study was not investigated analytically using the corresponding partial differential equations [17—21].

The currently known mathematical apparatus is discrete, which excludes the possibility of taking into account all the necessary parameters, which creates a problem according to which blind spots may be uncertain in one case or another, where a single phenomenon is analyzed. Based on all these statements, the present phenomenon is relevant.

MATERIALS AND METHODS

In the course of the study, methods of mathematical transformation, the formation of partial differential equations, the use of analytical modeling with the conversion of discrete expressions into analytical form were used. The current mathematical apparatus for the study of relevant phenomena, empirical and discrete data obtained during the research of the analyzed class are accepted as research materials.

RESEARCH

The derivation of a differential equation of one type or another is based on the transformation of available discrete data using the general methodology of an adjacent differential equation. In this case, it is necessary to derive the equation of electrical conductivity under the influence of an external electromagnetic field, for which it is necessary to derive the equation of electrical conductivity in its original form.

1. The equation of electrical conductivity

To do this, a model of an adjacent equation is used — the thermal conductivity equation, for the derivation of which the three-fold integral form of heat capacity (1) and the twice integral form of thermal conductivity (2) are used, for which the expression (3) applies.

The formed expression (3) can be reduced to the form of the thermal conductivity equation in (4).

Based on transformation (4), a similar formulation can be derived for the dynamic form of the electrical conductivity equation. To do this, the transformation is used initially for the form of electrical conductivity in a doubly integral form (5).

In this case, a dynamic characteristic is initially assumed with respect to electrical conductivity due to the fact that the initial problem is dynamic by definition, which makes the derived expression different from the classical problem of electrical conductivity in static form. Also in this case, the Laplace transform is used with respect to the Nabla operator and the gradient, as it was used earlier in the case of thermal conductivity. The next stage is to determine the electrical capacity (6) and give a similar expression for the sum of electrical capacity and electrical conductivity (7).

Thus, a partial differential equation was formulated describing the phenomenon of electrical conductivity, which can be transformed subsequently. For the phenomena of the electromagnetic field, the Poisson equation for the electrostatic field (8) is used, which will affect equation (7) and since each of the functions describes a phenomenon in a vector space with its individual elements, then by definition of functional analysis with respect to them, the vector addition method (9) can be used, which is also once again confirmed with the participation of the Nabla operator in (7), thus deducing the resulting form of the function with respect to a given phenomenon, Moreover, each of the functions in (9) is a solution of dynamic partial differential equations (7) and (8), respectively.

Moreover, in (8), the angle is understood as the mutual angle of interaction between vector functions. To solve the presented equation, it is necessary to use the Fourier method of separating variables for each of the selected cases, which can be presented in an expanded form, taking into account the use of individual functions. In a real representation, this equation can be used to describe the electrical transition in a semiconductor element constructed according to CdTe-SiO2-Si layers, in this case, there will be current sources between cadmium telluride and silicon, where a voltage of the order of 100—200 V. There is also an external field source close to the CdTe layer, separated from the silicon layer by an oxide film. The dimensions of each of the layers are known (Table 1).

Table 1. Dimensions of the layers of a semiconductor element

Subsequently, it is necessary to pay attention to each of the elements of the layer separately in order to derive the corresponding functions.

1. Cadmium telluride

Initially, to understand the type of cadmium telluride semiconductor, it is necessary to draw up a picture of the electronic shells of each of the elements (9).

From the resulting picture, it is clearly visible that cadmium used in the compound has 2 electrons on the outer shell, however, there are 4 electrons on the outer shell of tellurium, with which it is doped, moreover, 2 electrons are missing relative to the p-orbital before filling the outer orbit of tellurium, so that the entire compound has 2 external electrons. Because of this, there are a large number of free electrons in the compound, the total number of which can be calculated in (10), including by virtue of the calculated charge.

The resulting expression can be used for the Poisson equation of electrostatics with electron density (11), but at the same time, this equation is used in three-dimensional space, so it is necessary to calculate the number of free electrons in each of the projections of the general shape (12).

The values of charges relative to each plane can be translated into potential values, according to (13), from where the potentials are determined directly in each of the planes, but to convert the obtained constants into a function, it is necessary to use separately taken electrostatic Poisson equations for each of the measurements (14).

As a result, the general types of the function formed can be reduced to a single form, at the moment when the introduced three constants can obtain values using the values specified in (13) as boundary conditions in (15).

After substituting the values of the independent constants, the resulting form of the function can be formed relative to each of the dimensions (16).

Each of the functions can be modeled as a three-dimensional diagram that changes shape at different measurement values, so on a scale of 10—2 and 10—3 relative to x, y or a, b they are represented in the form (Fig. 1—3), but at the time of 10—5 and 10—6 in the same form, the analytical view of the representation of potentials becomes discrete (Figure 4—6).

Fig. 1. The first view of the graph of the function at (x, y) on a scale of 10 —2, 10 —3


Fig. 2. The second view of the graph of the function at (y, z) on a scale of 10 —2, 10 —3


Fig. 3. The third view of the graph of the function at (x, z) on a scale of 10 —2, 10 —3


Fig. 4. The first view of the graph of the function at (x, y) on a scale of 10 —5, 10 —6


Fig. 5. The second view of the graph of the function at (y, z) on a scale of 10 —5, 10 —6


Fig. 6. The third view of the graph of the function at (x, z) on a scale of 10 —5, 10 —6

An important note to three-dimensional graphs will also be the importance of defining exactly the law that they demonstrate, as opposed to the indicators presented in direct form. Thus, the boundary conditions of cadmium telluride were formulated at various scales.

1. Silicon oxide

The next stage of the analysis will be a similar consideration of the situation with crystalline silicon. When creating a semiconductor element at the time of contact between cadmium telluride and crystalline silicon, the transition of electrons through a layer of silicon oxide allows the interaction between the elements of the semiconductor element to be established, including for the direction of additional potential. However, in order to simulate the transition situation, it is necessary to pay attention to the electronic configuration of crystalline silicon (17).

From the presented formulation, it is clearly seen that 4 electrons are missing from the outer orbital or 4 holes are available. The same simulation can be performed with respect to the silicon oxide compound (18).

In the resulting oxide molecule, due to the fact that there are 2 oxygen atoms and a single silicon atom, there are 2 additional holes in the established compound, which turns the silicon oxide into a positive semiconductor element. As a result, a picture is created where cadmium telluride is an element saturated with free electrons, silicon oxide with free holes and crystalline silicon with newly free electrons. The resulting compound is a semiconductor element of the form n-p-n, where an interaction is formed between each of the elements.

At the moment of starting the current through cadmium telluride on the one hand and crystalline silicon on the other, a depleted layer is created at the point of contact of the layers, at the moment when the free electrons of cadmium telluride saturate the first words of silicon oxide on the one hand and the free electrons of crystalline silicon act on the oxide in a similar way on the other hand. This creates 2 depleted layers, the width of which varies depending not only on the applied voltage, but also on an external source. The transition described in this case can be displayed according to Fig. 7.

Fig. 7. Electron transfer scheme between cadmium telluride, silicon oxide and crystalline silicon

But in order to form a single law that applies to each of the layers, it is necessary to create boundary conditions that have been formed at the moment with respect to cadmium telluride, and for silicon oxide, based on a similar calculation, can be represented as follows.

Initially, it is necessary to calculate the total number of free holes and their total charge (19).

Which can be formulated in a similar way for the electrostatic Poisson equation with respect to this model (20), followed by calculating the density of holes with a representation relative to each of the planes, as well as further calculating holes in each of the planes and a similar value of charges in the same planes of the layer under study (21).

The calculated values of charges can be formed into the values of individual potentials based on the determination of the field strength potential (22).

Each formed value, by substituting into each of the forms of projections of the potential function in a static field, leads by further solution to the general form of the equation in projections (23), each of which can be transformed to the level of the general form of the direct function (24).

Since the dimensions of the silicon oxide layer under study are currently known, and general types of functions are presented, it is possible to substitute the resulting values and calculate independent variables (25), followed by the creation of a complete type of function that can describe silicon oxide with potential propagation in it (26).

The formulated functions are three-dimensional and can be implemented by organizing three-dimensional diagrams relative to each projection. Each of the functions can be implemented on 2 scales — relative to 10—3 and 10—2 units in x, y (Fig. 8—10) and 10—5 and 10—6 units relative to the same variables (Fig. 11—13), while paying attention that with increasing accuracy and decreasing the difference in units of three-dimensional graph becomes more approximate to the discrete formulation which also proves the quantum-discrete model, to which the analytical formation is initially reduced.

Figure 8. The first representation of the potential picture of silicon oxide on a scale of 10 -2- and 10 -3-units x, y


Fig. 9. The second representation of the potential picture of silicon oxide on a scale of 10 -2- and 10 -3-units x, y


Fig. 10. The third representation of the potential picture of silicon oxide on a scale of 10 -2- and 10 -3-units x, y


Fig. 11. The first representation of the potential picture of silicon oxide on a scale of 10 -5- and 10 -6-units x, y


Fig. 12. The second representation of the potential picture of silicon oxide on a scale of 10 -5- and 10 -6-units x, y


Fig. 13. The third representation of the potential picture of silicon oxide on a scale of 10 -5- and 10 -6-units x, y

As a result, the study of silicon oxide led to formulas, along with the study of the moments of contact of individual atoms. The obtained functions with respect to each measurement basis become boundary conditions for subsequent modeling of the problem on the scale of the entire equation of electrical conductivity, derived initially. But in order to conclude a general view of all boundary conditions, it is necessary to conduct a similar study for crystalline silicon, the last layer of a semiconductor element.

1. Crystalline silicon

The study of the properties of crystalline silicon begins with the formation of its electronic configuration, which was previously performed in (17), which implies the presence of additional two electrons in the outer orbit of silicon, which makes the semiconductor in the form of crystalline silicon saturated with electrons. To calculate the total number of charges and the total charge of each of the charges taken can be calculated in (28), which can also be used in an organized partial differential equation — the electrostatic Poisson equation (29).

Based on the results obtained, the charge density in the total density, as well as relative to each projection with the number of charges and the total value of charges, can be calculated in (30), which, as demonstrated in the case of silicon oxide and cadmium telluride, can be converted into the form of potential (31).

Each of the calculations performed become boundary conditions on the scale of further calculations. So, taking into account that the obtained values are general indicators of the charge in each of the projections of the crystalline silicon layer, then to derive the expression of functions for each of these projections, it is possible to use the Poisson equation with respect to each projection. At the same time, it is also formed based on further reducing expressions by volume, which is correlated when modeling three-dimensional graphs. So, at the moment, the known values create the following system of initially ordinary differential equations of the second order, then in the form of a system of doubly integral equations and as a result the expressions pass into the form of algebraic equations (32).

Because each of the algebraic equations is presented in the form of general forms, the functions can be derived from them in (33), despite the fact that each of them contains independent variables that are calculated later by using the potential values for boundary indicators calculated earlier in (31), leading to equations and their corresponding solution with respect to the independent variables in each equation in (34).

Substitution of the obtained values of independent variables leads to the transition of the previously derived forms of general functions (33) to the resulting form in (35).

Each function can be modeled in three–dimensional form, as it was formulated in previous cases, it is represented at two known scales relative to the variables x, y — relative to 10—2, 10—3 (Fig. 14—16) and 10—5, 10—6 (Fig. 17—19).

Fig. 14. The first representation of the potential picture of crystalline silicon on a scale of 10 -2- and 10 -3-units x, y


Fig. 15. The second representation of the potential picture of crystalline silicon on a scale of 10 -2- and 10 -3-units x, y


Fig. 16. The third representation of the potential picture of crystalline silicon on a scale of 10 -2- and 10 -3-units x, y


Fig. 17. The first representation of the potential picture of crystalline silicon on a scale of 10 -5- and 10 -6-units x, y


Fig. 18. The second representation of the potential picture of crystalline silicon on a scale of 10 -5- and 10 -6-units x, y


Fig. 19. The third representation of the potential picture of crystalline silicon on a scale of 10 -5- and 10 -6-units x, y

As a result of the simulated three-dimensional graphs, it can be clearly seen that each of the graphs is smooth and simple, unlike the previous two examples, where doped compounds of cadmium telluride and silicon oxide were involved. In this case, pure crystalline silicon is modeled, which makes it possible to obtain these graphs that correlate with reality.

Conclusions

Based on the results obtained, 3 separate models were formulated for cadmium telluride, silicon oxide and crystalline silicon, while in each case the functions are represented in three-dimensional space. In fact, it would be logical to arrange each of the functions one after the other, creating one single model of a semiconductor element.

So, in the form of the most discretely presented graph, modeling the entire semiconductor element, a collection of all currently obtained three-dimensional graphs in various combinations can be presented, which also corresponds to various combinations of the arrangement of the layers of the semiconductor element. In this case, each of the combinations can be represented by separate samples, where a separate role is assigned to 2 dimensions, and the third one changes, corresponding to the total sample in Tables 2—4.

Table 1. The first formulation of sets of graphs


Table 2. The second formulation of sets of graphs


Table 3. The second formulation of the sets of graphs

At the same time, each table can be represented in 2 scales 10—2, 10—3 in Fig. 20—22, while being equal in appearance from scales 10—5 and 10—6.

Fig. 20. The first form of the connected three-dimensional diagram in 10 —2 and 10 —3


Fig. 21. The second form of the connected three-dimensional diagram in 10 —2 and 10 —3


Fig. 22. The third form of the connected three-dimensional diagram in 10 —2 and 10 —3

As a result, a discrete general form of an organized semiconductor element was obtained, however, with an organized empirical calculation, the resulting variation can be represented according to the detected indicators. Thus, spectral dependences in interaction with an external corona discharge show a change in Fig. 24, when a change in height on the scale of the potential barrier required for electrons to overcome can be represented according to Fig. 23.

Fig. 23. The growth of the potential barrier of electrons with the presence of a third-party source of the potential field


Fig. 24. The spectral nature of the interaction under the action of an external electrostatic field

Each of the obtained results is currently an important and relevant element of the study, which is clearly confirmed according to the degree of correlation with the obtained theoretical data within the framework of setting boundary conditions for the derived equation of electrical conductivity.

Financing. Funding is provided through a common contact between the SRI «PRNR», Ferghana State University and Ferghana Polytechnic Institute within the framework of the Electron Laboratory LLC by project (Agreement No. 004).

Conclusion

As a result of the study, a modeling algorithm was presented that allows describing the phenomena of the electrical conductivity class under the influence of an external field. In particular, much attention was paid to the immediate modeling stage in a static form to an n-p-n type semiconductor element consisting of cadmium telluride, silicon oxide and crystalline silicon. Further work in this direction is also relevant, along with the subsequent reduction into an analytical form of the complex assembly of elements and their combinations involved in the assembly of the semiconductor element studied in this work.

Used literature

1. Deng, Z., Li, K., Priimagi, A. et al. Light-steerable locomotion using zero-elastic-energy modes. Nat. Mater. (2024).

2. Lee, KJ., Cros, V. & Lee, HW. Electric-field-induced orbital angular momentum in metals. Nat. Mater. 23, 1302–1304 (2024).

3. Lin, X., Zhang, S., Yang, M. et al. A family of dual-anion-based sodium superionic conductors for all-solid-state sodium-ion batteries. Nat. Mater. (2024).

4. An approach to identify and synthesize memristive III–V semiconductors. Nat. Mater. 23, 1322–1323 (2024).

5. Liu, L., Ji, Y., Bianchi, M. et al. A metastable pentagonal 2D material synthesized by symmetry-driven epitaxy. Nat. Mater. 23, 1339–1346 (2024).

6. Li, Z., Zhai, L., Zhang, Q. et al. 1T′-transition metal dichalcogenide monolayers stabilized on 4H-Au nanowires for ultrasensitive SERS detection. Nat. Mater. 23, 1355–1362 (2024).

7. Miura, M., Eley, S., Iida, K. et al. Quadrupling the depairing current density in the iron-based superconductor SmFeAsO1–xHx. Nat. Mater. 23, 1370–1378 (2024).

8. Hackett, L., Koppa, M., Smith, B. et al. Giant electron-mediated phononic nonlinearity in semiconductor–piezoelectric heterostructures. Nat. Mater. 23, 1386–1393 (2024).

9. Bae, J., Won, J., Kim, T. et al. Cation-eutaxy-enabled III–V-derived van der Waals crystals as memristive semiconductors. Nat. Mater. 23, 1402–1410 (2024).

10. Wang, X., Pan, C., Xia, N. et al. Fracture-driven power amplification in a hydrogel launcher. Nat. Mater. 23, 1428–1435 (2024).

11. Figgener, J., van Ouwerkerk, J., Haberschusz, D. et al. Multi-year field measurements of home storage systems and their use in capacity estimation. Nat Energy (2024).

12. Tregnago, G. Combining photovoltaic elements. Nat Energy 9, 1052 (2024).

13. Flexible participation of electrosynthesis in dynamic electricity markets. Nat Energy 9, 1062–1063 (2024).

14. Choo, S., Lee, J., Şişik, B. et al. Geometric design of Cu2Se-based thermoelectric materials for enhancing power generation. Nat Energy 9, 1105–1116 (2024).

15. Wang, J., Chortos, A. Performance metrics for shape-morphing devices. Nat Rev Mater 9, 738–751 (2024).

16. Shan, H., Poredoš, P., Chen, Z. et al. Hygroscopic salt-embedded composite materials for sorption-based atmospheric water harvesting. Nat Rev Mater 9, 699–721 (2024).

17. Parvesh Chander, Alisha Arora, Ankita Singh, Mohit Madaan, Nagendra Prasad Pathak, V.K. Malik. Exploration of room temperature magnetodielectric behavior in Nd0.5Dy0.5FeO3 thin films and transmission line resonators in GHz frequency range. Physica B: Condensed Matter. Volume 694, 1 December 2024, 416431

18. Naqash Hussain Malik, Shafaat Hussain Mirza, Sikander Azam, Muhammad Farooq Nasir, Muhammad Jawad, Nargis Bano, Muhammad Zulfiqar. Exploring the impact of hydrostatic pressure on the essential physical properties of BaTiO3 perovskite: A first principles quantum investigation and prospects for optoelectronic and thermoelectric applications. Physica B: Condensed Matter. Volume 694, 1 December 2024, 416430.

19. Dung Dang Duc, Luong Thi Kim Phuong, Nguyen Huu Lam, Duong Van Thiet, Luong Hong Dang, Nguyen Hoang Thoan, Vu Tien Lam, Duong Quoc Van. Optical, magnetic and electrical properties of new binary MnTiO3-modified Ba (Zr, Ti) O3 materials as solid solution. Physica B: Condensed Matter. Volume 694, 1 December 2024, 416444

20. S. Asadi Toularoud, H. Hadipour, H. Rahimpour Soleimani. Engineering the electronic and magnetic properties of monolayer TiS2 through systematic transition-metal doping. Physica B: Condensed Matter. Volume 694, 1 December 2024, 416413.

21. Wael M. Mohammed, M.M. El-Desoky, N. Abdllah, Hamdy F.M. Mohamed, E.E. Abdel-Hady, D.E. El Refaay. Relationship between structural, electrical properties and positron annihilation parameters of V2O5–Cu2O–P2O5 glasses.

22. Qihong Wen, Yifu Li, Baoqiang Xu, Hongwei Yang. Prediction of azeotropic behavior using physicochemical properties for Sn-based binary liquid alloys in vacuum distillation. Physica B: Condensed Matter. Volume 694, 1 December 2024, 416415.

ЮРИДИЧЕСКИЕ НАУКИ